Why Patients Ghost Us—and What We Can Do About It

Introduction
At Spectrum Psychological Services, we’re no strangers to the mystery of patient churn. Patients who once seemed engaged suddenly stop showing up. This phenomenon feels a lot like getting ghosted on a date: confusing, frustrating, and full of unanswered questions.
But churn isn’t just an inconvenience—it’s a major issue for mental health clinics. It disrupts treatment, impacts outcomes, and hits clinic revenue. That’s why I decided to investigate. With the power of data science, we’re solving the churn puzzle, one insight at a time.
What Is Patient Churn?
In simple terms, patient churn is when a patient stops engaging with the clinic—whether that means continuously skipping appointments, canceling last-minute, or vanishing entirely.
Here’s why churn matters:
- For Patients: Dropping out of care often means unmet mental health needs, which can lead to worsening symptoms.
- For Clinics: Churn disrupts schedules and reduces revenue, making it harder to provide care for everyone.
My mission was to figure out why patients churn—and how to prevent it.
The Role of Data Science
Churn isn’t random; it’s a pattern hidden in the data. I aimed to uncover that pattern by asking three key questions:
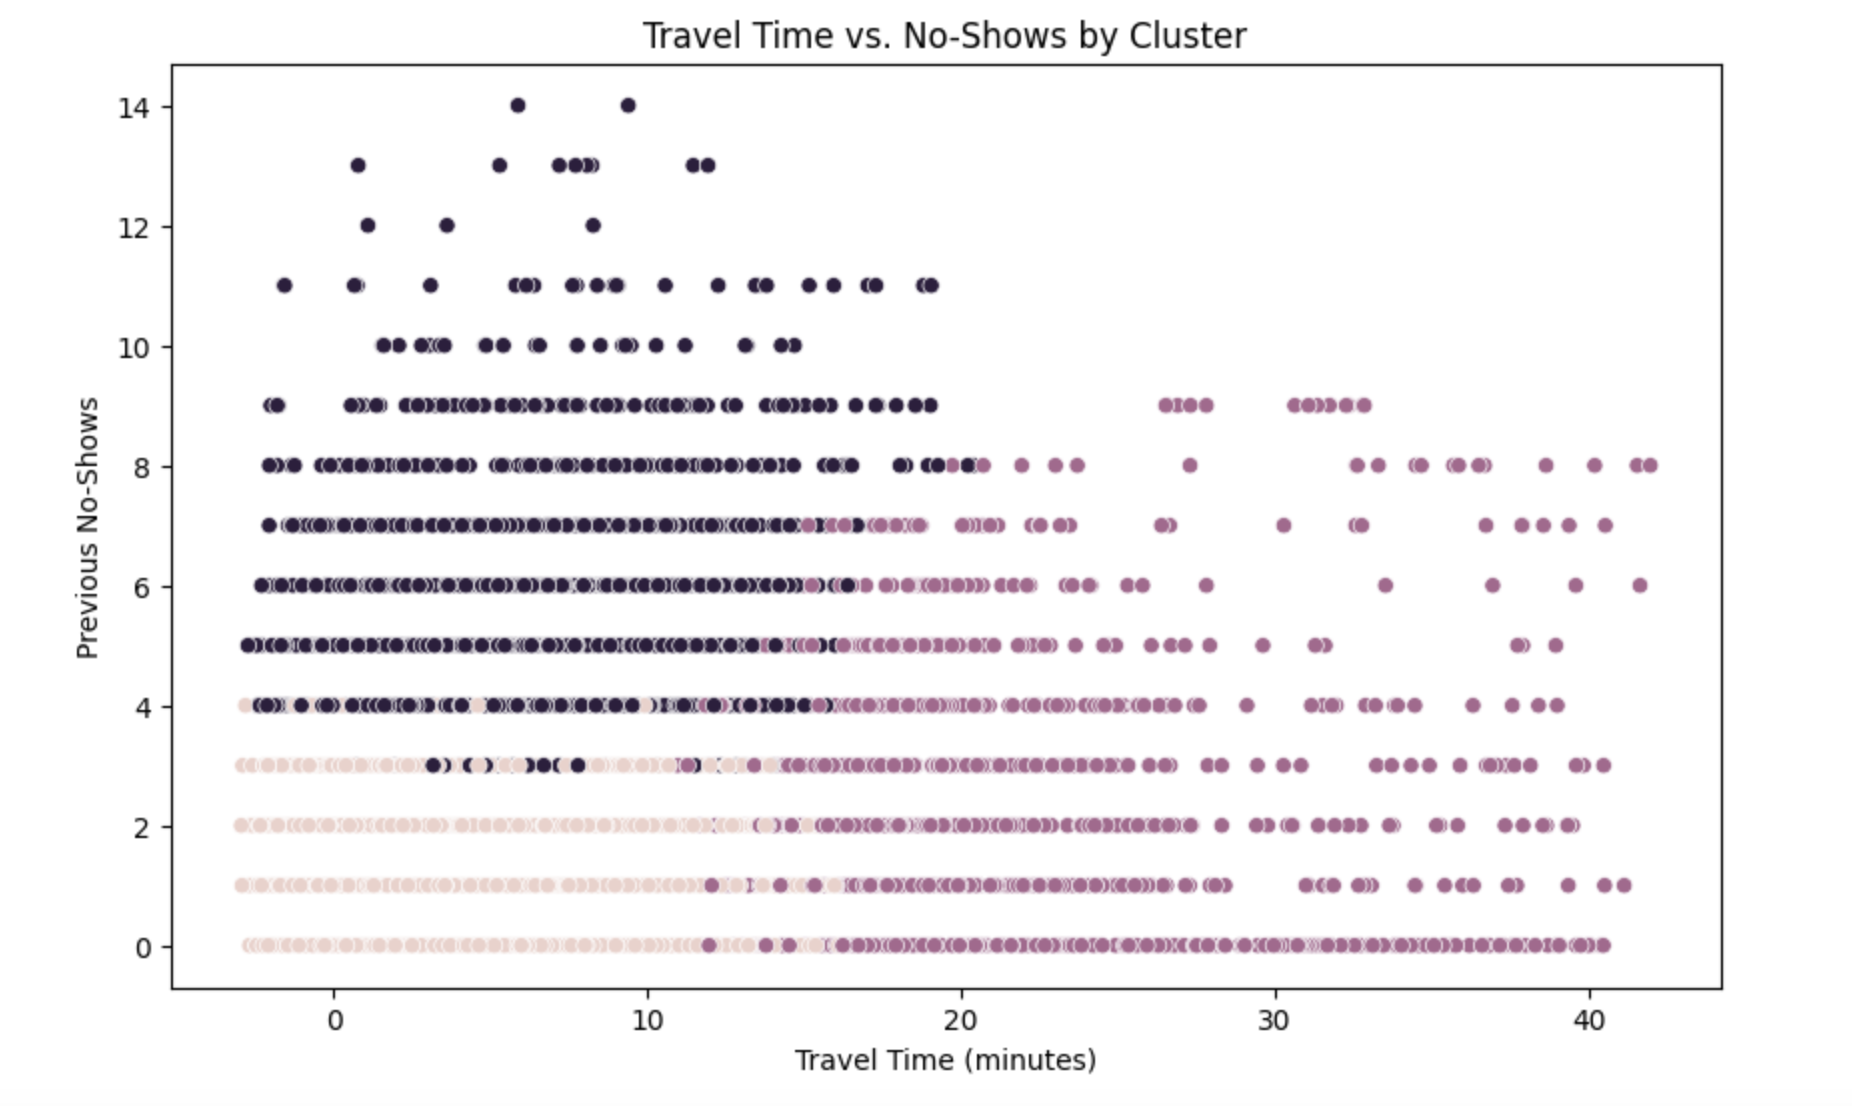
- Who are our patients? I used K-Means clustering to group patients based on shared traits like travel time, no-show history, diagnosis, appointment frequency, and more.
- What drives churn? I analyzed factors like demographics and engagement scores to identify risks.
- Can we predict churn before it happens? I built a Random Forest model to flag high-risk patients so we could intervene early.
This wasn’t just an academic exercise—it was a practical strategy to keep patients engaged and thriving.
Meet the Clusters
One of the first steps in the analysis was to group patients into clusters using K-Means. Think of clustering like seating people at a wedding: you group them by similarities, whether it’s mutual friends, relatives, or shared love of the dance floor. Here’s what I found:
- Cluster 1: The Regulars
- Traits: These patients live close, rarely miss appointments, and have consistent schedules.
- Risk of Churn: Low. These are the patients you can count on.
- Cluster 2: The Fence-Sitters
- Traits: These patients have moderate no-shows and irregular appointment patterns.
- Risk of Churn: Medium. They’re engaged but need a nudge to stay on track.
- Cluster 3: The Flight Risks
- Traits: These patients live far away, frequently miss appointments, and schedule sporadically.
- Risk of Churn: High. Without intervention, they’re likely to disengage entirely.

The Clues in the Data
I didn’t stop at clustering. To really understand churn, I needed to investigate its driving factors. Here are a few clues I uncovered:
- Travel Time: Patients with longer commutes are more likely to churn.
- No-Show History: Past behavior predicts future behavior. Patients with frequent no-shows have the highest churn rates.
- Appointment Frequency: Infrequent visits often signal disengagement.
- Demographics: Younger patients and those with lower incomes face more barriers to consistent care.
Each factor added a piece to the puzzle, helping to understand the full picture.
What’s Next?
Now that we’ve introduced the clusters and uncovered some initial clues, it’s time to dive deeper. In the next post, we’ll explore the churn risk factors in detail and show how predictive modeling is helping us act before patients disengage.
Final Thoughts
Patient churn might seem like a mystery, but with data science, it’s one we can solve. By identifying patient clusters and uncovering risk factors, we’re taking the first steps toward building stronger patient relationships and improving care.