The Churn Puzzle: Risk Factors and Predictions

Welcome Back!
Last time, I introduced you to our three patient clusters and started piecing together the churn mystery. Now, it’s time to dive deeper into the factors driving patient churn and reveal how predictive modeling helps us act before patients disengage.
If churn is the problem, risk factors are the breadcrumbs leading us to the solution. So, what clues did the data reveal? Let’s find out.
Unmasking the Risk Factors
Patient churn isn’t random—it’s driven by a combination of behavioral, logistical, and demographic factors. Here are the top culprits:
1. Travel Time: The Distance Barrier
What I Found:
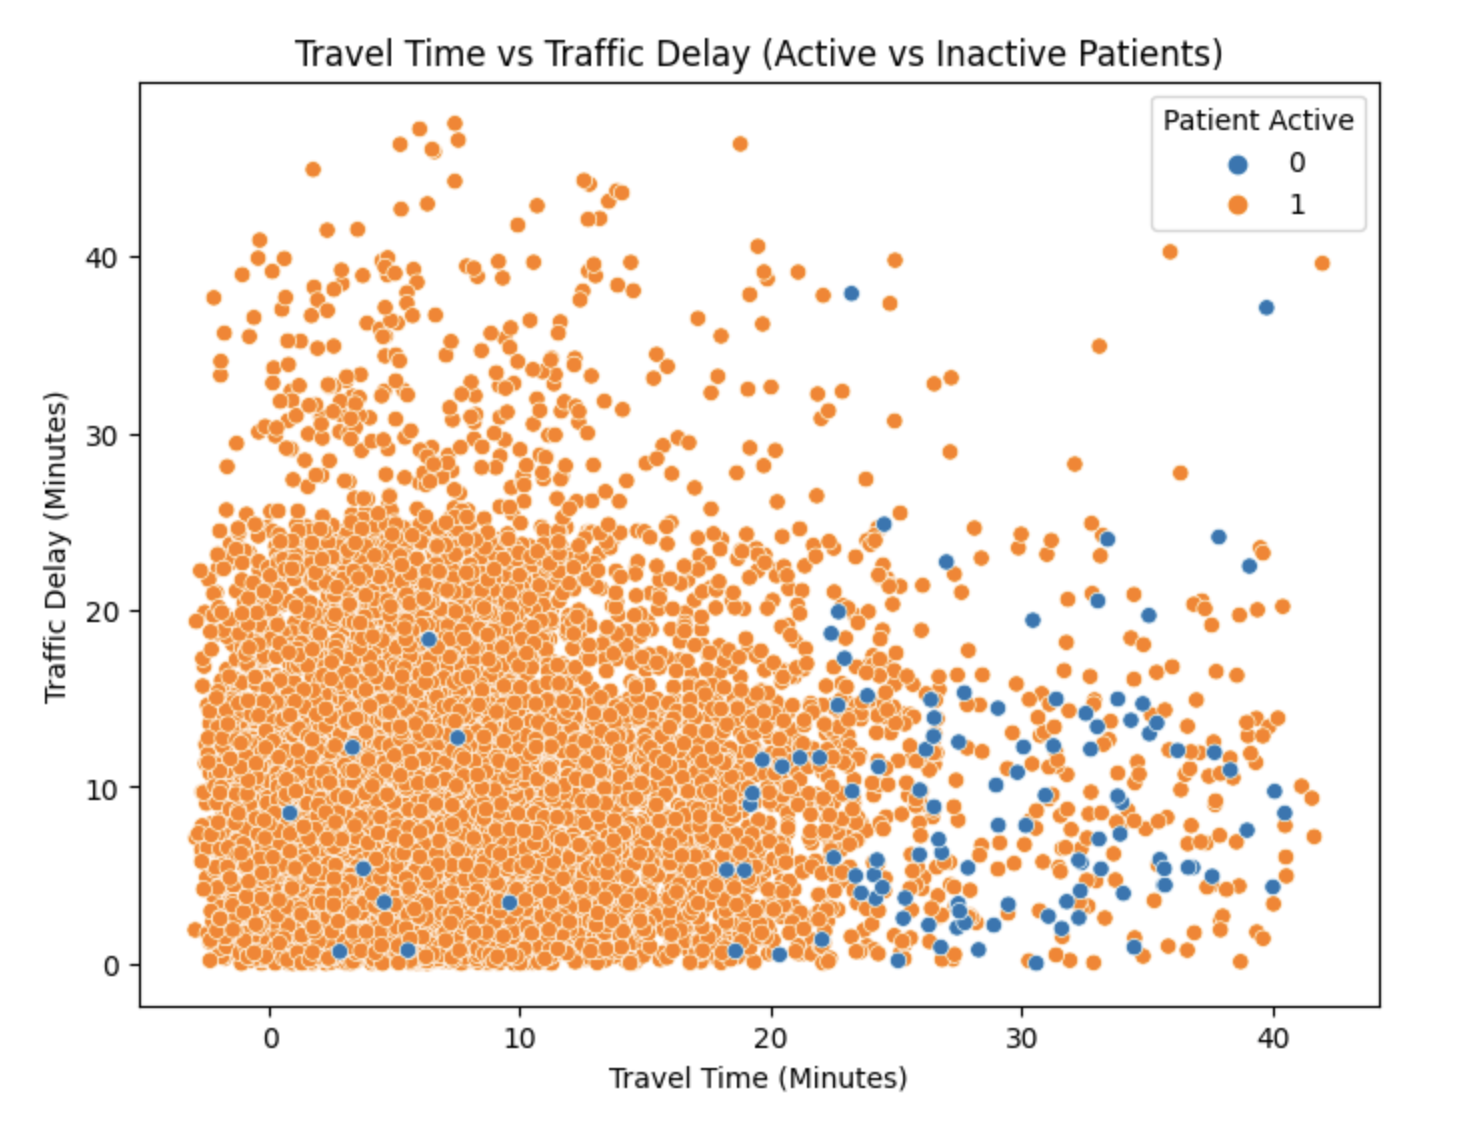
- Patients with longer commutes churn more frequently.
- Average Travel Time for Churned Patients: 29 minutes
- Average Travel Time for Retained Patients: 11 minutes
Why It Matters: Traveling to appointments can be a hurdle, especially for frequent visits. Long distances add stress, time, and cost, increasing the likelihood of disengagement.

2. No-Show History: Past Behavior Predicts Future Behavior
What I Found: Patients with 3+ prior no-shows have a 60% churn rate, compared to just 18% for those with no prior no-shows.
Why It Matters: Missed appointments are a red flag. They often signal disengagement and can snowball into complete disengagement if left unaddressed.
3. Appointment Frequency: Out of Sight, Out of Mind
What I Found:
- Churned Patients: Average time between appointments is 15 days.
- Retained Patients: Average time between appointments is 7 days.
Why It Matters: Infrequent appointments disrupt continuity of care, making it easier for patients to drift away. Regular interactions reinforce engagement and progress.
4. Demographics: The Hidden Influencers
What I Found:
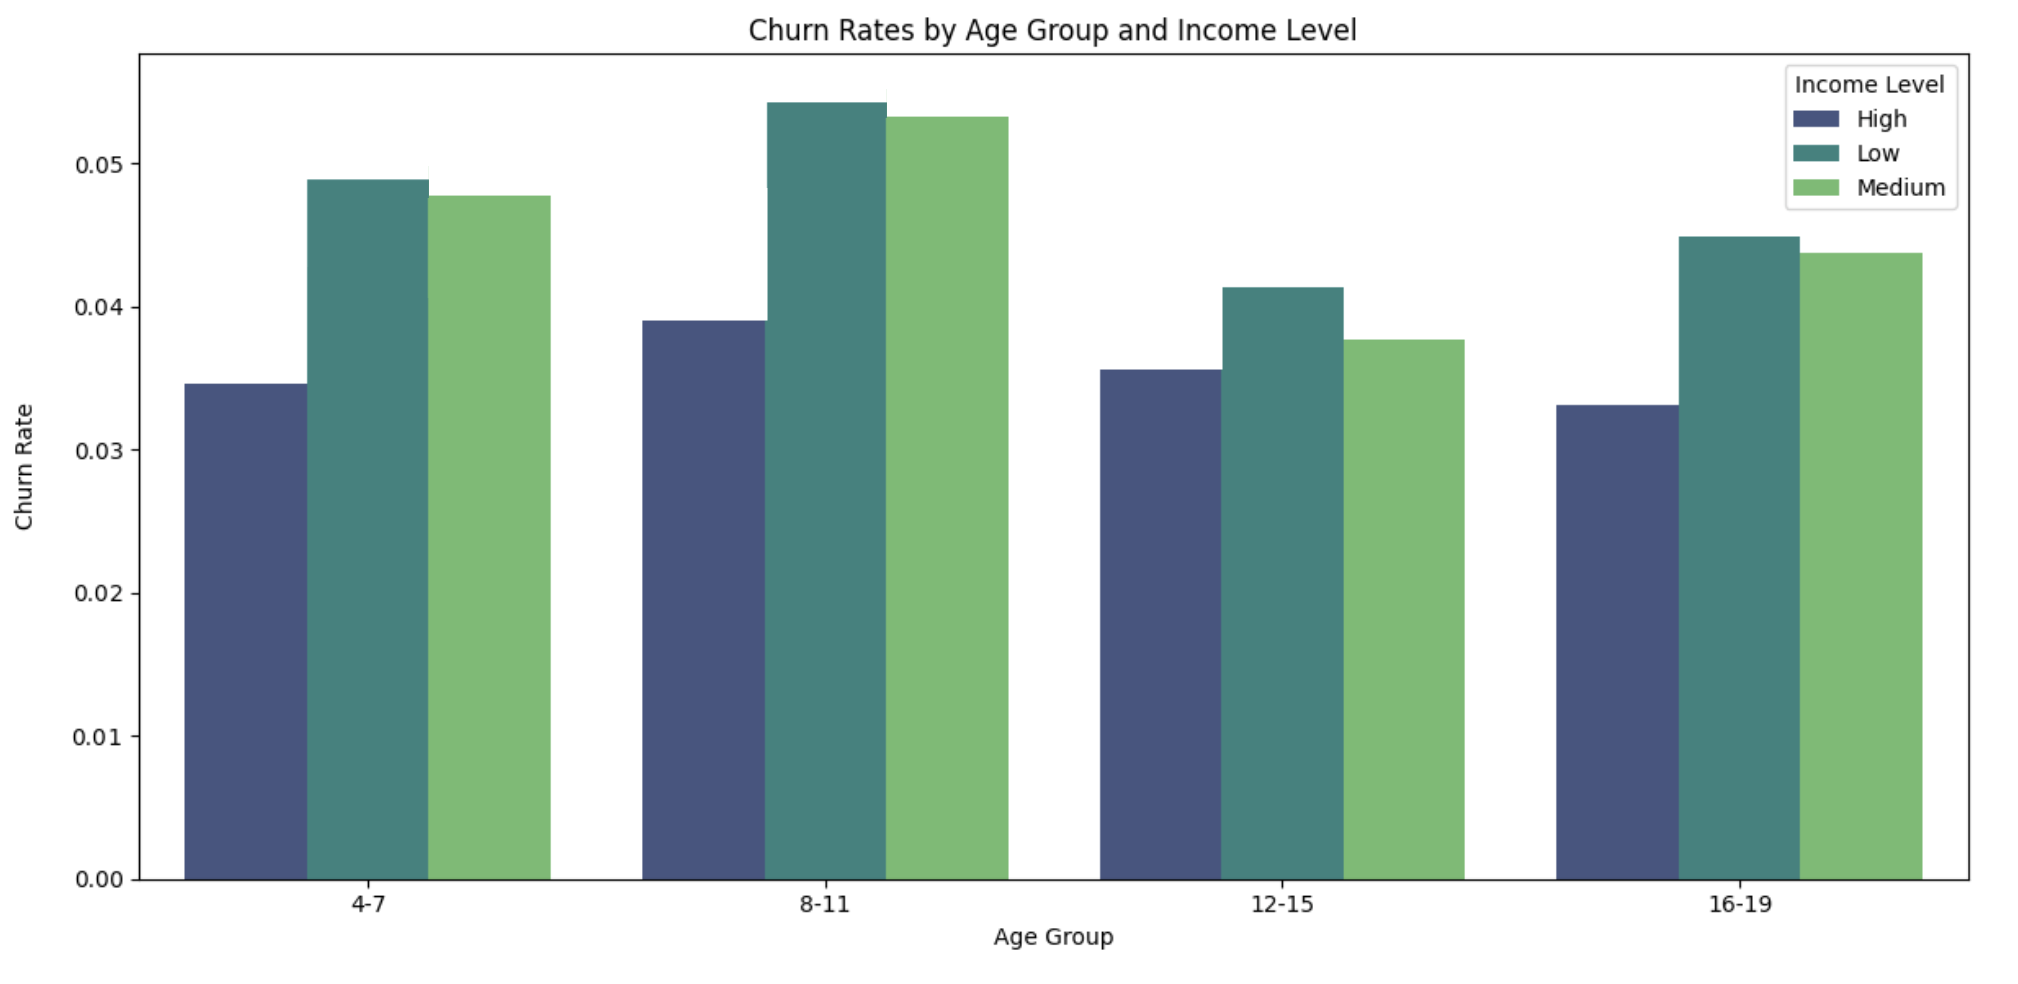
- Age Group with Highest Churn Rate: 8–11 years old
- Income Level with Highest Churn Rate: Below $30,000 annual income
Why It Matters: Younger patients may have more unstable schedules, and financial constraints can create barriers to consistent care.

Bringing It All Together
While each factor tells part of the story, the real power comes from analyzing how they interact. For example:
- Patients with long travel times and low income face double the barriers to engagement.
- Younger patients who schedule infrequent appointments are particularly vulnerable to churn.

Predicting Churn with Machine Learning
Understanding risk factors is only half the battle. To stay ahead of churn, we need to predict it before it happens. Enter: Random Forest, our algorithm of choice.
Why Random Forest?
- Handles Complexity: It can model interactions between multiple factors.
- Accuracy: Provides reliable predictions without overfitting.
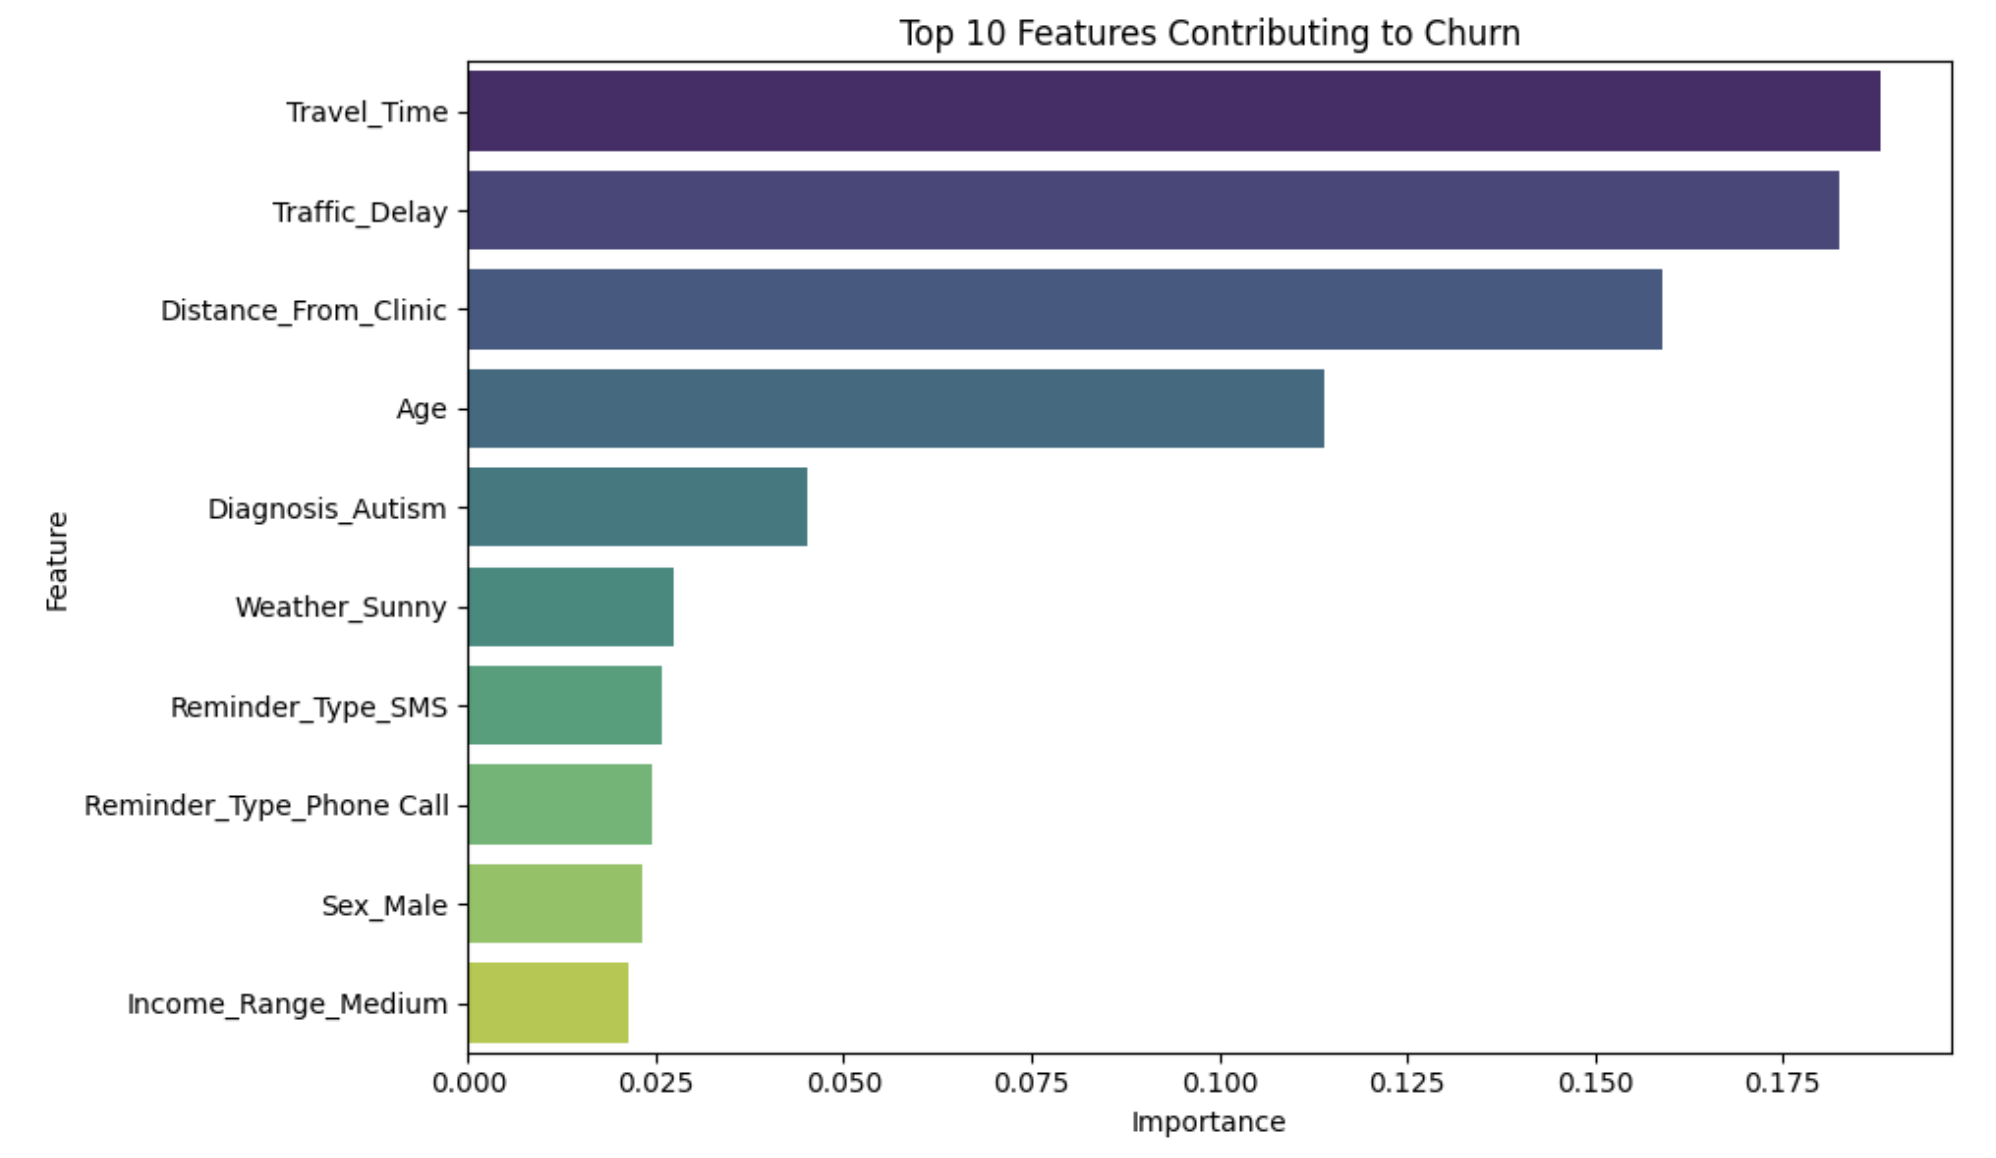
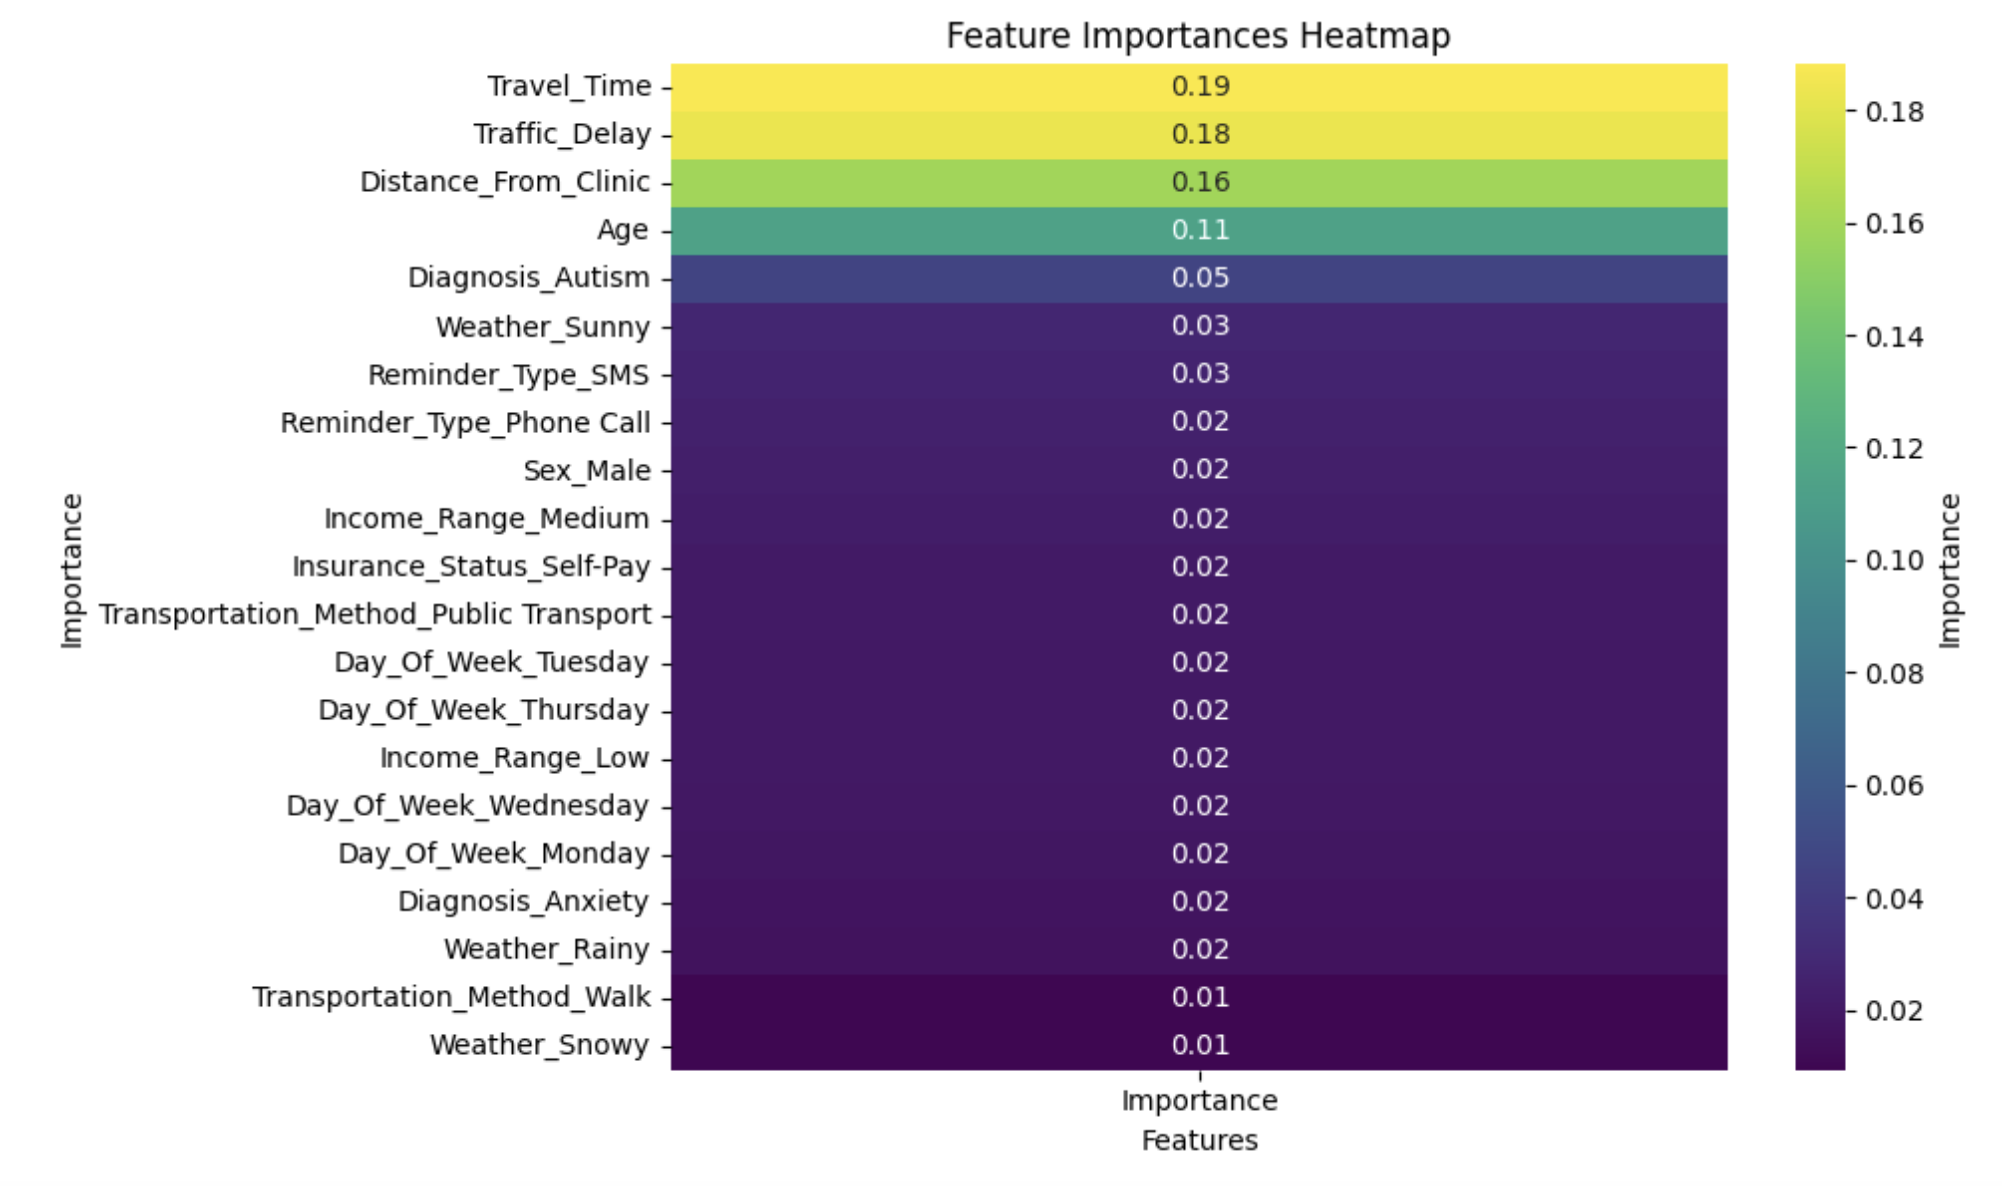
- Explainability: Identifies which features contribute most to predictions.
How It Works
Feature Selection:
- Key inputs: Travel time, no-show history, appointment frequency, demographics, and engagement scores.
- Feature importance analysis showed travel time, delay, distance, and age as top predictors.

Training and Evaluation:
- Training Set: 80% of the data.
- Test Set: 20% of the data for evaluation.
Performance Metrics:
- Accuracy: 84%
- Precision: 91%
- Recall: 68%
- F1-Score: 78%
Early Wins: Predictive Power in Action
Using the predictions, we’ve already seen significant improvements:
- Retention Boost: High-risk patients flagged by the model are now prioritized for follow-ups, leading to a 15% improvement in retention rates for our high-risk churn patients.
- Efficiency Gains: Staff can focus resources where they’re needed most.
What’s Next?
In the next post, I’ll show how we’re turning these insights into actionable strategies to improve retention and patient outcomes. From telehealth options to flexible scheduling, we’ll dive into the real-world changes inspired by data science.
Final Thoughts
Churn prediction isn’t just about numbers—it’s about understanding and supporting the people behind the data. By identifying who’s at risk and why, we’re making strides toward a more patient-centered approach to care.