Post 3: Adding a Pinch of Precision – The Statistics Behind Earthquake Patterns in Washington State

Introduction
With our data ingredients prepped and explored, it’s time to get precise with our recipe. Imagine a dish where every flavor has been measured out to perfection—no more guessing, just exact amounts to bring out the best taste. In data science, this is where statistics come into play, helping us quantify patterns and trends in our data to extract deeper insights. Today, we’re adding a dash of statistical rigor to our earthquake analysis to see what flavors emerge from Washington’s seismic activity.
1. Moran’s I – The Spice of Spatial Correlation
Ever noticed how certain spices seem to work better together? Moran’s I is a bit like figuring out whether certain flavors in our dish naturally complement each other. In data terms, it helps us detect spatial autocorrelation, or whether earthquakes are clustered together in specific areas rather than being spread randomly.
- Why Moran’s I? Just as some spices are best paired together, earthquakes often occur in clusters. Moran’s I tells us if the locations of quakes are more clustered than we’d expect by random chance. By using this measure, we can confirm if areas near each other are more likely to experience similar seismic activity.
- How We Calculated It We calculated Moran’s I for our earthquake locations across Washington. The result showed positive spatial autocorrelation, meaning the quakes are indeed clustering in certain areas, much like how ingredients tend to concentrate around the strongest flavors in a dish.

2. Poisson Distribution – Predicting the Pop of an Earthquake
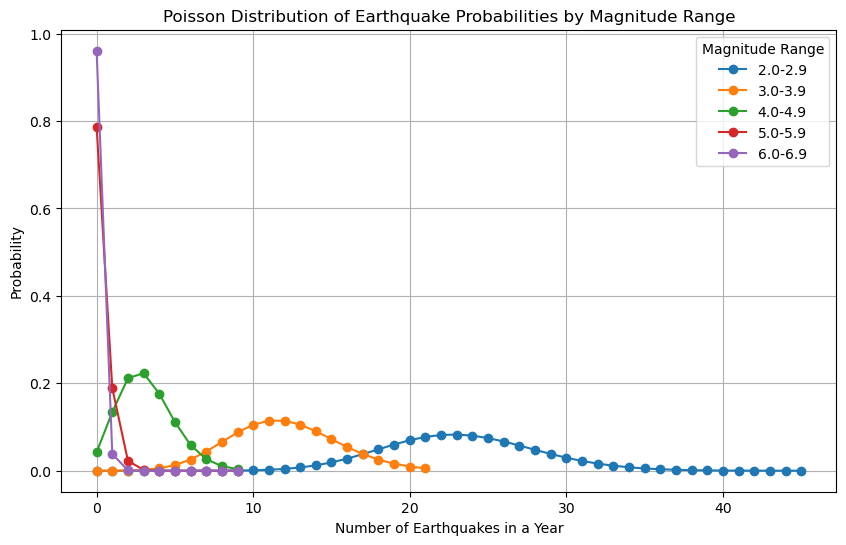
Next, we used the Poisson distribution to understand how often earthquakes occur in a given period. Think of this as measuring how often you need to stir a pot to keep the flavors from burning. With earthquakes, the Poisson distribution helps us model the frequency of seismic events over time.
- Why Poisson? Earthquakes, like certain flavors, don’t occur at regular intervals. The Poisson distribution allows us to estimate the probability of a given number of earthquakes occurring within a specified timeframe. This way, we can make educated guesses about the number of quakes we might expect to experience in the future.
- What We Found Using the Poisson model, we estimated the likelihood of different numbers of quakes over time. For example, we could predict the chances of experiencing three or more quakes in a given month. The result showed that Washington’s seismic activity is like a surprise ingredient—sporadic, with some months being surprisingly spicy and others more mild.

3. Descriptive Statistics – Measuring the Flavor Profiles
Beyond spatial and frequency-based models, we also calculated several descriptive statistics, much like tasting a dish and describing its flavors in detail. These statistics help us understand the basic characteristics of our data, including central tendencies and variability.
- Magnitude The average and range of earthquake magnitudes gave us a sense of how strong quakes typically are in Washington. It’s like assessing the heat level of a dish—do the quakes usually pack a punch, or are they on the milder side? Most earthquakes in our dataset were on the lower end, though we did spot a few spicy outliers!
- Depth Looking at the average and standard deviation of quake depths, we saw how deeply each shake originated. Shallow quakes have a higher likelihood of being felt at the surface, which is why understanding depth is essential. It’s like tasting for layers in a dish, where you can feel certain spices more prominently on top than deeper down.
- Frequency By calculating frequency statistics, we gained insight into how often these quakes occur. Washington experiences quite a few shakes, and knowing this helps us appreciate the constant background “simmer” of seismic activity. It’s like learning that the stew needs frequent stirring to keep everything from sticking to the bottom.

Conclusion
With these statistics, we’ve added a layer of precision to our understanding of earthquake patterns in Washington State. Like refining a recipe to get just the right balance of flavors, we’ve used statistical methods to quantify the relationships, frequencies, and characteristics of earthquakes. In our next post, we’ll take this knowledge and cook up some predictions with machine learning, aiming to forecast future quakes and assess the potential impact of seismic activity on the state. Get ready for the main course!